
If you’re running an ecommerce brand in 2025 and still guessing your ad performance or struggling with customer data, it’s time to fix that. Triple Whale is the go-to platform for ecommerce brands that want real-time insights, clear attribution, and simplified decision-making.
In this guide, I’ll show you step-by-step how to use Triple Whale as a beginner, how to understand your key metrics, and how to use the platform to improve your ROAS and profit. Whether you’re scaling paid ads or managing inventory, this tutorial will walk you through the most powerful features inside Triple Whale. Let’s get into it.
What Is Triple Whale?
Triple Whale is a data and analytics tool built for ecommerce businesses. It connects your Shopify store, paid ad platforms, and email tools in one place. Its main job is to show you where your sales are coming from, how well your ads are doing, and how your customer base is growing over time. It’s like having a real-time marketing dashboard that tells you what’s working and what’s not.
Step 1: Getting Started with the Dashboard
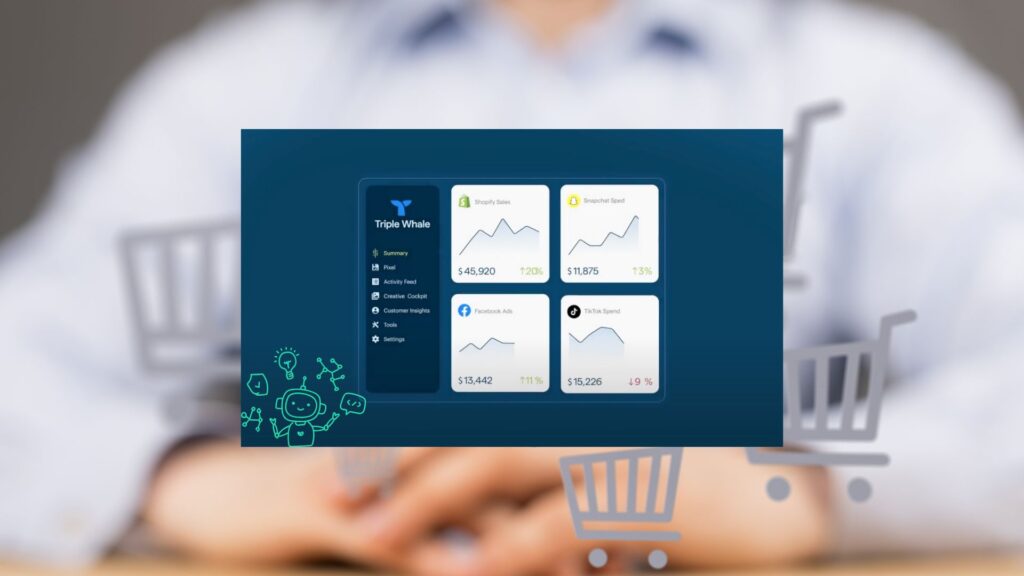
Once you connect your Shopify store and ad accounts, you’ll land on the Summary Page. This is your customizable command center. You’ll see metrics like daily sales, ad spend, and ROAS right at the top.
You can pin or unpin widgets, so you only see the stuff that matters to your business. Hide the fluff and focus on what moves the needle.
For example, if you want to focus on profitability, pin the Gross Profit over Ad Spend tile. If you’re testing new ad creatives, pin the New Customer ROAS tile.
Step 2: Key Metrics You Should Track
Triple Whale simplifies tracking by breaking down performance into actionable metrics. Here are the main ones you should focus on.
- Ecosystem ROAS (ME ROAS): This is your total revenue over ad spend. It tells you how efficient your ad dollars are across platforms.
- New Customer ROAS: Shows how much revenue you’re getting per dollar of ad spend from new customers. Great for measuring acquisition campaigns.
- Gross Profit over Ad Spend: Looks at how much actual profit you’re earning for every dollar spent on ads.
- Lean-in vs Lead-out Metrics: Lean-in metrics show what’s happening right now. Lead-out metrics show long-term trends like retention and lifetime value.
Step 3: Attribution Tracking with Triple Pixel
This is where Triple Whale shines. Their attribution tool called Triple Pixel tracks the full customer journey across Facebook, Google, email, and even organic.
To get started, install the pixel and make sure it’s active on your Shopify store. Triple Whale will begin capturing data right away. When setting up attribution, start with the “Triple Attribution Only” model. This avoids double-counting from other platforms and gives you a more honest view of conversions. Over time, you can test other models like first click or last click, depending on your marketing strategy.
Step 4: Analyze Creatives in the Creative Dashboard
Running paid ads, the Creative Dashboard lets you track every single creative by ROAS, CAC, and spend. This is where you find your top-performing videos or images.
You can filter by:
- Prospecting or Retargeting campaigns
- Spend amount
- ROAS or click-through rate
If you run video ads, keep an eye on the Thumb Stop Ratio. This tells you how good your hook is. If people aren’t stopping in the first 3 seconds, your creative needs work.
You can also set spend thresholds to only view creatives with enough data for solid conclusions.
Step 5: Customer Insights and Product Journeys
Triple Whale makes it easy to see how customers shop your store.
Check out:
- AOV metrics: You get mean, median, and mode so you can identify outliers and trends.
- Sankey Diagram: This shows what products customers buy on their first, second, and third purchases. It’s great for planning upsells and bundles.
This is how you find those winning combos that bring customers back if you want to increase LTV.
Step 6: Sales Cycle and Lifetime Value (LTV)
Understanding your sales cycle helps with cash flow and ad budgeting.
- Sales Cycle Tool: Tells you how many days it takes for customers to return.
- 60 and 90-Day LTV: Tracks how much a customer is worth after 60 or 90 days.
- Cohorts: Groups customers by signup month and shows how much they spend over time.
If your 60-day LTV is $80 and your CAC is $40, you’re on the right path.
Step 7: Forecasting Goals and Budget Pacing
Triple Whale also lets you set goals and simulate how changes in your funnel affect revenue.
You can input:
- Target conversion rate
- Ad spend goal
- Average order value
The forecasting tool shows how those changes affect your bottom line. It’s like seeing into the future so you can course-correct early.
Step 8: Attribution and Customer Journey Reports
You can click into Customer Journeys and see every step a customer took before buying. From their first TikTok click to their email open and final purchase. These reports are gold for optimizing retargeting or understanding multi-touch sales. You can also view Aggregated Journeys to see the most common paths to conversion.
Final Thoughts
Triple Whale is one of the most powerful tools ecommerce brands can use in 2025. It helps you understand how every dollar works, which creative converts best, and how your customers behave across channels.
If you’re just getting started, focus on the basics:
- Set up your pixel
- Pin your core metrics
- Review your creative data weekly
- Monitor your LTV and CAC
Once you have that in place, Triple Whale will guide your strategy like a GPS for your ecommerce business.